Analytiska rapporter


Uppnå exceptionella affärsresultat genom att öka effektiviteten och kvaliteten i dina processer, samtidigt som du minskar kostnaderna med hjälp av vårt IoT-aktiverade IWMS.
Förbättra medarbetarnas hybrida arbetsplatsupplevelse och öka företagets motståndskraft.
Främja effektivitet och hållbarhet samtidigt som du förbättrar upplevelsen på campus.
Få kontakt med dina kunder och stärk relationerna genom transparent kommunikation, effektivitet och innovation med vår affärslösning för Facility Services.
Håll din kompatibla leasinghantering, beräkning av vinst- och förlustrelaterade kostnader, kassaflöden och balansräkningsparametrar för leasing uppdaterad med vår lösning för Lease Accounting.
Ta reda på hur du följer reglerna
Optimera byggnadernas prestanda med en integrerad, öppen plattform som kopplar samman olika typer av tekniker.
Utöka dina Planon-lösningar med våra Marketplace-applikationer, en one-stop-shop där du hittar ett brett utbud av specialapplikationer.


Planon är ett globalt marknadsledande programvaruföretag inom smart och hållbar fastighetshantering. Vi kopplar samman byggnader, människor och processer genom att eliminera datasilor och samla informationen i en gemensam IT-plattform. Det innebär att vi förser samtliga intressenter – användare, ägare och tjänsteleverantörer – med användbara och meningsfulla insikter.


Läs mer om Planons programvara och hur vi kan hjälpa din organisation.

Planon har åtagit sig att skapa en positiv inverkan på människors liv och vår planet.


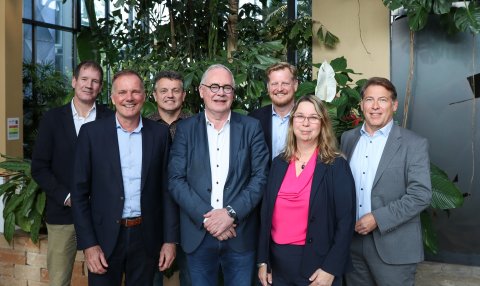
Våra kunder har valt Planon för vår förmåga att effektivt utvärdera deras utmaningar och snabbt leverera lösningar som tillgodoser deras unika behov. Vårt erfarna ledarskapsteam är fast beslutet att främja en dynamisk, engagerad kultur och erbjuda förstklassiga lösningar för smarta byggnader till våra nuvarande och framtida kunder över hela världen.
Läs mer om de företag som har anslutit sig till Planon Group under åren och tillfört strategisk kapacitet till vårt företag, vilket stärker vår position med sin egen distinkta expertis och tillgångar.
Läs mer om Planon Group företag


Vi är fast beslutna att skydda säkerheten, integriteten och tillgängligheten för våra produkter, system och data. I vårt Trust Center hittar du den information du behöver om säkerhet, efterlevnad, integritet och prestanda för Planon Cloud-tjänsterna.
Följ med oss på vår resa mot att bli en globalt erkänd marknadsledare inom intelligenta, hållbara programvarulösningar för fastighetsförvaltning. Vi sätter våra medarbetare i centrum för vår verksamhet och skapar en inspirerande och säker miljö där vi alla kan arbeta, lära, vistas och utvecklas.
Att utmana dig själv och samtidigt hitta den perfekta balansen mellan arbete och fritid är drömmen. Kolla in våra lediga tjänster och hitta ditt framtida jobb bland våra globala karriärmöjligheter.
Vi värdesätter kommunikationen med våra användare och kunder och ser fram emot att höra från dig.
Anslut dig till vårt nätverk av partners och marknadsledare för att bredda din kundbas och utforska nya möjligheter.
Tillsammans maximerar vi affärsnyttan för dig. Ta reda på hur vårt samarbete med marknadsledare och teknikleverantörer öppnar dörren till förstklassig rådgivning och ett brett utbud av ytterligare alternativ.

It should be no surprise that today’s business environment revolves around data. Across all parts of the organisation, the ability to demonstrate clear data-driven decision making has become key to proving your value to senior management or the C-suite.
Yes, an Integrated Workplace Management System (IWMS) is great at generating data and optimising processes. But there is no point in collecting data or ‘facts’ that you can’t explain effectively or act upon. You don’t need all the data in the world, you need the right data. The data that will have an impact on the bottom line, by demonstrating efficiency, making a case for appropriate budget levels, or cutting costs.
So, how do you collect the ‘right data’ and how do you report this data to your executives? Let’s consider some steps I have found to be essential in this effort.
The goal should be to capture all the data needed to manage your organisation, to create the context to understand what the data really means, and to show that the real estate and facilities departments are supporting the larger corporate goals. To do this, what kind of information do you need? What do you want to report on? Understanding the information that you are trying to manage will help you focus on the business processes needed to capture it along the way.
Don’t be distracted by reporting on something just because the software you are using can report on it really well. Unless that data actually matters to you, don’t spend time on things you don’t need. Instead, I suggest asking the opposite question: ‘What is the best way to get the information I need into the system with the least effort for end-users?’ The easier it is for end-users to do, the better your data will be.
Consider the data captured for a single work order. What are you asking from the employee submitting a request? What are you requiring from the field technician? Are forms and user interfaces designed to make the user experience smart and efficient? Will they get form fatigue and then start putting in ‘easy’ or default answers that won’t help in making business decisions? Can any of the data be collected automatically through sensors, GPS or other means?
Taking the time to consider each stakeholder’s perspective on the process is the key to good solution design, and ultimately to quality data from your IWMS. Be very clear on the benefits to the people involved; ensure they know why they are being asked to complete certain tasks or enter information, why their accuracy is important to the business, and how entering that data has value to them. Solution architects can design efficient user interfaces, automation, and business processes that will capture the data that managers want to collect.
Once you have obtained accurate data and made sure your metrics can be aligned with the corporate goals, you are moving in the direction of data-driven decision making! Pulling the data you want to present in a good and clear report is the next step. But what defines a ‘good’ report?
As a starting point, consider that a good data-centric report shows only relevant data in a clear, visual way. Use the terminology of your organisation to clarify what is being reported, and keep individual charts or tables simplified, like building blocks. Most importantly, correlations between one graph or diagram and other data represented in the report should be clear in a single glance. When people from other departments look at your report, they should have no problems in understanding what the data describes and the relationships between different data fields. In short, a good data-centric report tells a story, with confidence and logic, that will resonate with the intended audience.
The Planon software includes reporting tools, and even sample reports and dashboards, that help in this process:
With the recent release of Planon Connect for Analytics, the potential to mine your Planon IWMS data, in combination with real estate and facility operations information from other sources, has been extended to the enterprise Business Intelligence level.
While reporting on metrics and KPIs is essential for business operations, many real estate and facility management departments want to go a step further and dig deeper into the data. This requires analytics.
Space managers are very interested in occupancy ratios, for example, understanding how office space is really being used. On the surface, we may see departmental stats or trends in occupancy, but a data-centric organisation will look deeper. Why is there a particular preference for certain rooms and why are some are not used at all? How confident are we that our ‘data’ is telling us the truth?
On the maintenance side, managers generally have a good understanding of how they are spending their budgets, but can struggle finding the deeper information on how efficiently their teams are working, or how it impacts key stakeholders. Analytics can help them in two ways: first to understand where there is ‘noise’ in the data – often the result of ineffective business processes which can be targeted for improvement; and ultimately to investigate their ability and capacity to support organisational goals for the workplace as key to an excellent employee experience.
Well thought out business processes in your IWMS system can give you great data. Analytics gives you the opportunity to actually understand what you think you know. And to discover things you didn’t know before.